


Kubernetes: From Zero to Production
Kubernetes: From Zero to Production
If you’re a junior engineer who just heard “we use Kubernetes” at standup and nodded along, this post is for you. If you’re a senior who wants a concise reference on production-grade patterns, keep reading — we’ll get there too.
Kubernetes (K8s) is a container orchestration platform. That’s the textbook answer. The real answer: it’s the system that takes your Docker containers and decides where they run, how many copies exist, and what happens when they crash.
Part 1: The Mental Model (Junior Level)
Why Kubernetes Exists
Imagine you have a web app packaged as a Docker container. Running it locally is easy:
1
docker run -p 3000:3000 my-app:v1
But in production you need:
- Multiple copies running for availability
- Automatic restarts when crashes happen
- Rolling updates with zero downtime
- Load balancing across instances
- Resource limits so one app can’t eat all CPU
Kubernetes solves all of this declaratively — you describe what you want, and Kubernetes figures out how to make it happen.
The Cluster Anatomy
Before writing a single YAML file, internalize this hierarchy:
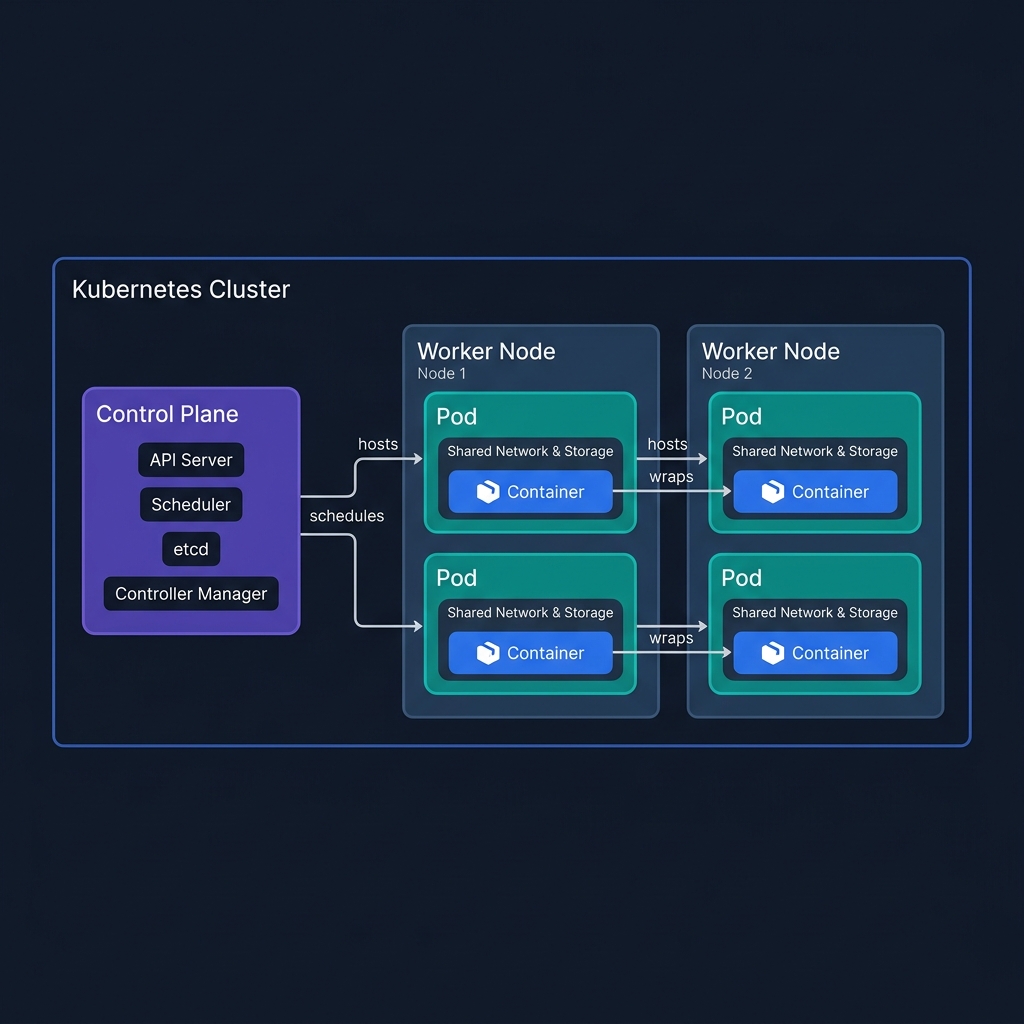
| Layer | What it is | Analogy |
|---|---|---|
| Cluster | The entire Kubernetes system | A data center |
| Control Plane | The brain — decides where and how everything runs | The manager’s office |
| Node | A worker machine (VM or physical server) | A physical server rack |
| Pod | One or more containers sharing a network and storage | A shipping container |
| Container | The actual running application process | The goods inside the shipping container |
The key insight: you never deploy containers directly to nodes. Kubernetes always schedules at the Pod level. A Pod is the smallest unit Kubernetes can schedule, scale, or restart.
Why does Pod exist as a concept?
Sometimes two processes need to run side-by-side and share the same network interface (e.g., an app container + a log-forwarding sidecar). The Pod groups them so they communicate over localhost and share mounted volumes — without being a single monolithic container.
- Control Plane: Makes all decisions. The API Server is its front door.
- Nodes: Worker machines (VMs or physical) that actually run your containers.
- Pods: The smallest deployable unit — one or more containers that share network and storage.
Core Objects You Must Know
Pod — wraps one or more containers:
1
2
3
4
5
6
7
8
9
10
apiVersion: v1
kind: Pod
metadata:
  name: my-app-pod
spec:
  containers:
  - name: my-app
    image: my-app:v1
    ports:
    - containerPort: 3000
You almost never create Pods directly. You use a Deployment instead.
Deployment — manages Pods, handles rollouts and replicas:
1
2
3
4
5
6
7
8
9
10
11
12
13
14
15
16
17
18
19
20
21
22
23
24
25
26
apiVersion: apps/v1
kind: Deployment
metadata:
  name: my-app
spec:
  replicas: 3           # Run 3 copies
  selector:
    matchLabels:
      app: my-app
  template:
    metadata:
      labels:
        app: my-app
    spec:
      containers:
      - name: my-app
        image: my-app:v1
        ports:
        - containerPort: 3000
        resources:
          requests:
            memory: "128Mi"
            cpu: "250m"
          limits:
            memory: "256Mi"
            cpu: "500m"
Service — gives your Pods a stable network address:
1
2
3
4
5
6
7
8
9
10
11
apiVersion: v1
kind: Service
metadata:
  name: my-app-svc
spec:
  selector:
    app: my-app       # Routes to Pods with this label
  ports:
  - port: 80
    targetPort: 3000
  type: ClusterIP     # Internal only
Service types at a glance:
| Type | Accessible From | Use Case |
|---|---|---|
ClusterIP |
Inside cluster only | Internal microservices |
NodePort |
Outside via Node IP + port | Dev/testing |
LoadBalancer |
Outside via cloud LB | Production external traffic |
Namespace — virtual clusters within a cluster:
1
2
kubectl create namespace production
kubectl create namespace staging
Use namespaces to isolate environments and teams within the same cluster.
Essential kubectl Commands
1
2
3
4
5
6
7
8
9
10
11
12
13
14
15
16
17
18
19
20
21
22
23
24
25
26
27
28
29
# Context & cluster info
kubectl config get-contexts
kubectl config use-context my-cluster

# Get resources
kubectl get pods
kubectl get pods -n production          # specific namespace
kubectl get all                         # everything in default ns

# Inspect
kubectl describe pod my-app-pod
kubectl logs my-app-pod
kubectl logs my-app-pod -f              # follow (like tail -f)
kubectl logs my-app-pod --previous      # logs from crashed container

# Execute into a running pod
kubectl exec -it my-app-pod -- /bin/sh

# Apply / delete manifests
kubectl apply -f deployment.yaml
kubectl delete -f deployment.yaml

# Scale quickly
kubectl scale deployment my-app --replicas=5

# Rollout management
kubectl rollout status deployment/my-app
kubectl rollout history deployment/my-app
kubectl rollout undo deployment/my-app  # rollback
Part 2: Production Patterns (Mid-Level)
ConfigMaps & Secrets
Never hardcode configuration in your image. Externalize it:
1
2
3
4
5
6
7
8
# ConfigMap for non-sensitive config
apiVersion: v1
kind: ConfigMap
metadata:
  name: app-config
data:
  LOG_LEVEL: "info"
  API_BASE_URL: "https://api.internal.example.com"
1
2
3
4
5
6
7
8
# Secret for sensitive values (base64 encoded, not encrypted by default!)
apiVersion: v1
kind: Secret
metadata:
  name: app-secrets
type: Opaque
data:
  DB_PASSWORD: cGFzc3dvcmQxMjM=   # base64("password123")
Inject into your Deployment:
1
2
3
4
5
6
7
8
spec:
  containers:
  - name: my-app
    envFrom:
    - configMapRef:
        name: app-config
    - secretRef:
        name: app-secrets
In production, use Sealed Secrets, AWS Secrets Manager, or Vault instead of plain K8s Secrets — the base64 encoding is not encryption.
Health Checks: Liveness & Readiness Probes
This is one of the most impactful things you can configure:
1
2
3
4
5
6
7
8
9
10
11
12
13
14
15
16
17
spec:
  containers:
  - name: my-app
    livenessProbe:       # If this fails → container is restarted
      httpGet:
        path: /healthz
        port: 3000
      initialDelaySeconds: 15
      periodSeconds: 10
      failureThreshold: 3

    readinessProbe:      # If this fails → Pod removed from Service endpoints
      httpGet:
        path: /ready
        port: 3000
      initialDelaySeconds: 5
      periodSeconds: 5
| Probe | Failure Behavior | Use For |
|---|---|---|
livenessProbe |
Restart the container | Detecting deadlocks/hangs |
readinessProbe |
Remove from load balancer | Startup time, dependency checks |
startupProbe |
Block other probes until ready | Slow-starting apps |
Ingress — HTTP Routing at the Edge
Instead of a LoadBalancer Service per app (expensive), use one Ingress controller:
1
2
3
4
5
6
7
8
9
10
11
12
13
14
15
16
17
18
19
20
21
22
23
24
25
apiVersion: networking.k8s.io/v1
kind: Ingress
metadata:
  name: app-ingress
  annotations:
    nginx.ingress.kubernetes.io/rewrite-target: /
spec:
  rules:
  - host: api.example.com
    http:
      paths:
      - path: /users
        pathType: Prefix
        backend:
          service:
            name: user-service
            port:
              number: 80
      - path: /orders
        pathType: Prefix
        backend:
          service:
            name: order-service
            port:
              number: 80
Horizontal Pod Autoscaler (HPA)
Scale pods automatically based on CPU/memory:
1
2
3
4
5
6
7
8
9
10
11
12
13
14
15
16
17
18
apiVersion: autoscaling/v2
kind: HorizontalPodAutoscaler
metadata:
  name: my-app-hpa
spec:
  scaleTargetRef:
    apiVersion: apps/v1
    kind: Deployment
    name: my-app
  minReplicas: 2
  maxReplicas: 20
  metrics:
  - type: Resource
    resource:
      name: cpu
      target:
        type: Utilization
        averageUtilization: 70
Always set both minReplicas (for availability) and maxReplicas (for cost control).
Part 3: Advanced Engineering (Senior Level)
Resource Management: Requests vs. Limits
This is where most teams get burned in production:
1
2
3
4
5
6
7
resources:
  requests:       # Guaranteed amount — used for scheduling decisions
    memory: "256Mi"
    cpu: "250m"
  limits:         # Hard cap — container is killed/throttled if exceeded
    memory: "512Mi"
    cpu: "1000m"
Common pitfalls:
- No limits set → One runaway pod starves the whole node
- Limits == Requests → No burst headroom, leads to unnecessary throttling
- Memory limit hit → OOMKilled (Out Of Memory killed). Check with
kubectl describe pod - CPU limit hit → Throttled, not killed. Causes latency spikes, not crashes — harder to debug
Use LimitRange to set namespace-level defaults:
1
2
3
4
5
6
7
8
9
10
11
12
13
14
apiVersion: v1
kind: LimitRange
metadata:
  name: default-limits
  namespace: production
spec:
  limits:
  - default:
      cpu: "500m"
      memory: "256Mi"
    defaultRequest:
      cpu: "100m"
      memory: "128Mi"
    type: Container
Pod Disruption Budgets (PDB)
Ensures minimum availability during voluntary disruptions (node upgrades, scaling down):
1
2
3
4
5
6
7
8
9
apiVersion: policy/v1
kind: PodDisruptionBudget
metadata:
  name: my-app-pdb
spec:
  minAvailable: 2         # At least 2 pods must be running
  selector:
    matchLabels:
      app: my-app
Without a PDB, a node drain can take all your pods down at once.
Deployment Strategies
Rolling Update (default):
1
2
3
4
5
6
spec:
  strategy:
    type: RollingUpdate
    rollingUpdate:
      maxSurge: 1          # Allow 1 extra pod during update
      maxUnavailable: 0    # Never go below desired replicas
Blue-Green via labels: Run two Deployments (v1, v2), switch the Service selector:
1
kubectl patch service my-app-svc -p '{"spec":{"selector":{"version":"v2"}}}'
Canary: Route a percentage of traffic to the new version by controlling replica ratios. If you need fine-grained traffic splitting, use a service mesh (Istio, Linkerd).
RBAC — Who Can Do What
1
2
3
4
5
6
7
8
9
10
11
12
13
14
15
16
17
18
19
20
21
22
23
24
25
26
# Role: what actions are allowed on what resources
apiVersion: rbac.authorization.k8s.io/v1
kind: Role
metadata:
  name: pod-reader
  namespace: production
rules:
- apiGroups: [""]
  resources: ["pods", "pods/log"]
  verbs: ["get", "list", "watch"]

---
# RoleBinding: assign the role to a user/service account
apiVersion: rbac.authorization.k8s.io/v1
kind: RoleBinding
metadata:
  name: read-pods
  namespace: production
subjects:
- kind: User
  name: alice
  apiGroup: rbac.authorization.k8s.io
roleRef:
  kind: Role
  name: pod-reader
  apiGroup: rbac.authorization.k8s.io
Principle of least privilege: Every service account should only have the permissions it actually needs. Audit regularly with tools like rbac-police or kubectl-who-can.
Observability Stack
A production cluster needs three pillars:
| Pillar | What | Common Stack |
|---|---|---|
| Metrics | CPU, memory, request rate, error rate | Prometheus + Grafana |
| Logs | Structured application logs | Fluentd/Fluent Bit → Elasticsearch/Loki |
| Traces | Distributed request tracing | Jaeger, Tempo, AWS X-Ray |
Key metrics to alert on:
- Pod restart count > 0 in 5 min window → likely crashloop
- HPA at
maxReplicas→ capacity ceiling hit - PVC usage > 80% → storage will fill up
- API server latency p99 > 1s → cluster health degrading
Multi-Tenancy Patterns
As clusters grow, teams need isolation:
1
2
3
4
5
6
7
8
9
10
11
12
13
Option A: Namespace per team (soft isolation)
  - Cheap, simple
  - Shared nodes — one team's noisy workload affects others
  - Use ResourceQuota + LimitRange per namespace

Option B: Cluster per environment (hard isolation)
  - Production cluster / Staging cluster / Dev cluster
  - Higher operational overhead
  - Recommended for compliance-sensitive workloads

Option C: Virtual clusters (vcluster)
  - Full K8s API inside a namespace
  - Strong isolation without the cost of separate clusters
Key Engineering Checklist for Production
| Area | Checklist Item |
|---|---|
| Availability | replicas >= 2 for all critical services |
| Availability | PodDisruptionBudget configured |
| Availability | readinessProbe on every container |
| Reliability | livenessProbe configured |
| Resources | requests and limits set on every container |
| Resources | ResourceQuota per namespace |
| Security | No containers running as root |
| Security | RBAC: least-privilege service accounts |
| Security | Secrets not stored in plain K8s Secrets |
| Observability | Structured logging (JSON) |
| Observability | Metrics exported (Prometheus annotations) |
| Deployment | maxUnavailable: 0 on rolling updates |
| Deployment | Image tags are never latest in production |
Kubernetes: 제로부터 프로덕션까지
스탠드업에서 “우리 Kubernetes 써요”라는 말에 고개를 끄덕였지만 실제로 무슨 뜻인지 몰랐다면, 이 포스트가 바로 당신을 위한 글입니다. 프로덕션 수준의 패턴을 빠르게 정리하고 싶은 시니어라면, 계속 읽어보세요.
Kubernetes(K8s)는 컨테이너 오케스트레이션 플랫폼입니다. 교과서적인 정의죠. 실용적인 정의는 이렇습니다: Docker 컨테이너를 어디서 실행할지, 몇 개를 유지할지, 그리고 죽었을 때 어떻게 할지를 결정해주는 시스템입니다.
Part 1: 핵심 개념 (주니어 레벨)
Kubernetes가 존재하는 이유
로컬에서 Docker 컨테이너 하나 실행하는 건 쉽습니다:
1
docker run -p 3000:3000 my-app:v1
하지만 프로덕션에서는 다음이 필요합니다:
- 고가용성을 위한 복수 복제본
- 크래시 시 자동 재시작
- 다운타임 없는 롤링 업데이트
- 인스턴스 간 로드 밸런싱
- 하나의 앱이 CPU를 독점하지 못하게 하는 리소스 제한
Kubernetes는 이 모든 것을 선언적으로 해결합니다. 원하는 상태를 선언하면, Kubernetes가 실현 방법을 찾아냅니다.
클러스터 구조
YAML 파일을 단 한 줄도 작성하기 전에, 먼저 이 계층 구조를 머릿속에 새기세요.
| 계층 | 무엇인가 | 비유 |
|---|---|---|
| Cluster | 전체 Kubernetes 시스템 | 데이터 센터 |
| Control Plane | 두뇌 — 어디에, 어떻게 실행할지 결정 | 관리자 사무실 |
| Node | 워커 머신 (VM 또는 물리 서버) | 물리적인 서버 랙 |
| Pod | 네트워크와 스토리지를 공유하는 하나 이상의 컨테이너 | 화물 컨테이너 |
| Container | 실제로 실행되는 애플리케이션 프로세스 | 컨테이너 안의 화물 |
핵심 통찰: 컨테이너를 노드에 직접 배포하는 일은 없습니다. Kubernetes는 항상 Pod 단위로 스케줄링합니다. Pod는 Kubernetes가 스케줄링, 확장, 재시작할 수 있는 최소 단위입니다.
왜 Pod라는 개념이 존재하는가?
때로는 두 프로세스가 나란히 실행되면서 동일한 네트워크 인터페이스를 공유해야 합니다 (예: 앱 컨테이너 + 로그 전송 사이드카). Pod는 이들을 묶어서 localhost로 통신하고 마운트된 볼륨을 공유하게 해줍니다 — 하나의 거대한 단일 컨테이너가 되지 않으면서도요.
- Control Plane: 모든 결정을 내리는 두뇌. API Server가 그 관문입니다.
- Node: 실제로 컨테이너를 실행하는 워커 머신(VM 또는 물리 서버)입니다.
- Pod: 가장 작은 배포 단위. 네트워크와 스토리지를 공유하는 하나 이상의 컨테이너입니다.
반드시 알아야 할 핵심 오브젝트
Pod는 컨테이너를 감싸는 단위입니다. 하지만 Pod를 직접 생성하는 일은 거의 없습니다. 대신 Deployment를 사용합니다.
Deployment는 Pod를 관리하고, 롤아웃과 레플리카 수를 제어합니다. replicas: 3으로 설정하면 항상 3개의 Pod가 실행되도록 유지합니다.
Service는 Pod에 안정적인 네트워크 주소를 부여합니다. Pod는 언제든 죽고 다시 생성되므로, IP가 바뀌어도 Service를 통해 안정적으로 접근할 수 있습니다.
Service 타입 비교:
| 타입 | 접근 범위 | 사용 사례 |
|---|---|---|
ClusterIP |
클러스터 내부만 | 내부 마이크로서비스 간 통신 |
NodePort |
외부 (Node IP + 포트) | 개발/테스트 환경 |
LoadBalancer |
외부 (클라우드 LB) | 프로덕션 외부 트래픽 |
Namespace는 하나의 클러스터 안에서 가상의 클러스터를 만드는 방법입니다. 팀이나 환경(production, staging)별로 격리할 때 사용합니다.
필수 kubectl 명령어
1
2
3
4
5
6
7
8
9
10
11
12
13
14
15
16
17
18
19
20
21
22
23
# 리소스 조회
kubectl get pods
kubectl get pods -n production     # 특정 네임스페이스
kubectl get all                    # 기본 네임스페이스의 모든 리소스

# 상세 정보 확인
kubectl describe pod my-app-pod
kubectl logs my-app-pod
kubectl logs my-app-pod -f         # 실시간 로그 (tail -f)

# 실행 중인 Pod에 접속
kubectl exec -it my-app-pod -- /bin/sh

# 매니페스트 적용/삭제
kubectl apply -f deployment.yaml
kubectl delete -f deployment.yaml

# 즉시 스케일
kubectl scale deployment my-app --replicas=5

# 롤아웃 관리
kubectl rollout status deployment/my-app
kubectl rollout undo deployment/my-app   # 롤백
Part 2: 프로덕션 패턴 (중급 레벨)
ConfigMap & Secret
절대 설정값을 이미지에 하드코딩하지 마세요. 외부화해야 합니다. ConfigMap은 민감하지 않은 설정을, Secret은 DB 비밀번호 같은 민감한 값을 저장합니다.
실제 프로덕션에서는 Kubernetes Secret의 base64 인코딩은 암호화가 아닙니다. Sealed Secrets, AWS Secrets Manager, HashiCorp Vault 사용을 강력히 권장합니다.
헬스 체크: Liveness & Readiness Probe
컨테이너의 상태를 Kubernetes에 알려주는 가장 중요한 설정 중 하나입니다.
| Probe | 실패 시 동작 | 사용 목적 |
|---|---|---|
livenessProbe |
컨테이너 재시작 | 데드락/행 상태 감지 |
readinessProbe |
로드밸런서에서 제거 | 시작 시간, 의존성 체크 |
startupProbe |
다른 Probe 차단 | 시작이 느린 앱 |
Ingress — 엣지에서의 HTTP 라우팅
앱마다 LoadBalancer Service를 쓰면 비용이 급증합니다. 대신 Ingress Controller 하나로 도메인/경로 기반 라우팅을 처리하세요. api.example.com/users는 user-service로, /orders는 order-service로 라우팅하는 식입니다.
HPA (수평 Pod 자동 확장)
CPU 70% 이상이면 Pod를 자동으로 늘리고, 낮아지면 줄입니다. 항상 minReplicas(가용성 보장)와 maxReplicas(비용 제어)를 함께 설정하세요.
Part 3: 심화 엔지니어링 (시니어 레벨)
리소스 관리: Requests vs. Limits
프로덕션에서 팀들이 가장 많이 실수하는 부분입니다.
- Requests: 스케줄링 결정에 사용하는 보장된 양. “이 Pod를 실행하려면 최소 이 정도가 필요해”
- Limits: 하드 상한선. 초과하면 메모리는 OOMKilled, CPU는 쓰로틀링됩니다.
흔한 실수들:
- Limits 미설정 → 하나의 Pod가 노드 전체 리소스를 독점
- Limits = Requests → 버스트 여유분 없음, 불필요한 쓰로틀링 발생
- 메모리 Limit 초과 → OOMKilled로 갑자기 Pod 종료 (kubectl describe로 확인)
- CPU Limit 초과 → 종료되지 않고 쓰로틀링 → 레이턴시 급등 (디버깅이 더 어려움)
Pod Disruption Budget (PDB)
노드 업그레이드, 스케일 다운 등의 자발적 중단(voluntary disruption) 중에도 최소 가용성을 보장합니다. PDB 없이 노드를 drain하면 해당 노드의 Pod가 한꺼번에 내려갈 수 있습니다.
배포 전략
Rolling Update (기본값): maxUnavailable: 0으로 설정하면 항상 원하는 레플리카 수를 유지하면서 순차적으로 교체합니다.
Blue-Green: 두 Deployment(v1, v2)를 동시에 실행하고, Service의 selector를 전환하는 방식으로 즉각적인 전환 및 즉각적인 롤백이 가능합니다.
Canary: 레플리카 비율로 트래픽을 분산합니다. 세밀한 트래픽 분할이 필요하면 Istio, Linkerd 같은 서비스 메시를 사용하세요.
RBAC — 누가 무엇을 할 수 있는가
Role은 어떤 리소스에 어떤 행위가 허용되는지를 정의하고, RoleBinding은 그 Role을 사용자 또는 서비스 어카운트에 연결합니다. 최소 권한 원칙을 철저히 지키세요. 모든 서비스 어카운트는 실제로 필요한 권한만 가져야 합니다.
관찰 가능성 (Observability)
프로덕션 클러스터에는 세 가지 축이 필요합니다:
| 축 | 내용 | 일반적인 스택 |
|---|---|---|
| 메트릭 | CPU, 메모리, 요청률, 오류율 | Prometheus + Grafana |
| 로그 | 구조화된 애플리케이션 로그 | Fluentd → Elasticsearch / Loki |
| 트레이스 | 분산 요청 추적 | Jaeger, Tempo, AWS X-Ray |
핵심 알림 기준:
- 5분 이내 Pod 재시작 횟수 > 0 → CrashLoopBackOff 가능성
- HPA가
maxReplicas에 도달 → 용량 한계 도달 - PVC 사용량 > 80% → 스토리지 포화 임박
- API 서버 레이턴시 p99 > 1초 → 클러스터 전반 성능 저하
프로덕션 엔지니어링 체크리스트
| 영역 | 항목 |
|---|---|
| 가용성 | 중요 서비스는 replicas >= 2 |
| 가용성 | PodDisruptionBudget 구성 |
| 가용성 | 모든 컨테이너에 readinessProbe 설정 |
| 안정성 | livenessProbe 구성 |
| 리소스 | 모든 컨테이너에 requests와 limits 설정 |
| 리소스 | 네임스페이스별 ResourceQuota |
| 보안 | root로 실행되는 컨테이너 없음 |
| 보안 | RBAC: 최소 권한 서비스 어카운트 |
| 보안 | 시크릿을 평문 K8s Secret에 저장하지 않음 |
| 관찰성 | 구조화된 로깅 (JSON 형식) |
| 관찰성 | Prometheus 메트릭 노출 |
| 배포 | Rolling Update: maxUnavailable: 0 |
| 배포 | 프로덕션에서 이미지 태그로 latest 사용 금지 |