


k-Nearest Neighbors (k-NN) Algorithm
Introduction to k-NN and Machine Learning
- AI refers to technologies that enable computers to perform human-like tasks.
- Machine Learning (ML) is one of the methods used to achieve AI.
- It uses statistical techniques to learn from data and solve problems without explicit programming.
- Deep Learning is a subset of ML based on deep neural networks.
- It is currently the most active field in ML, showing exceptional performance in computer vision, speech processing, and natural language processing.
ML Workflow and Taxonomy
- The basic workflow of ML is as follows:
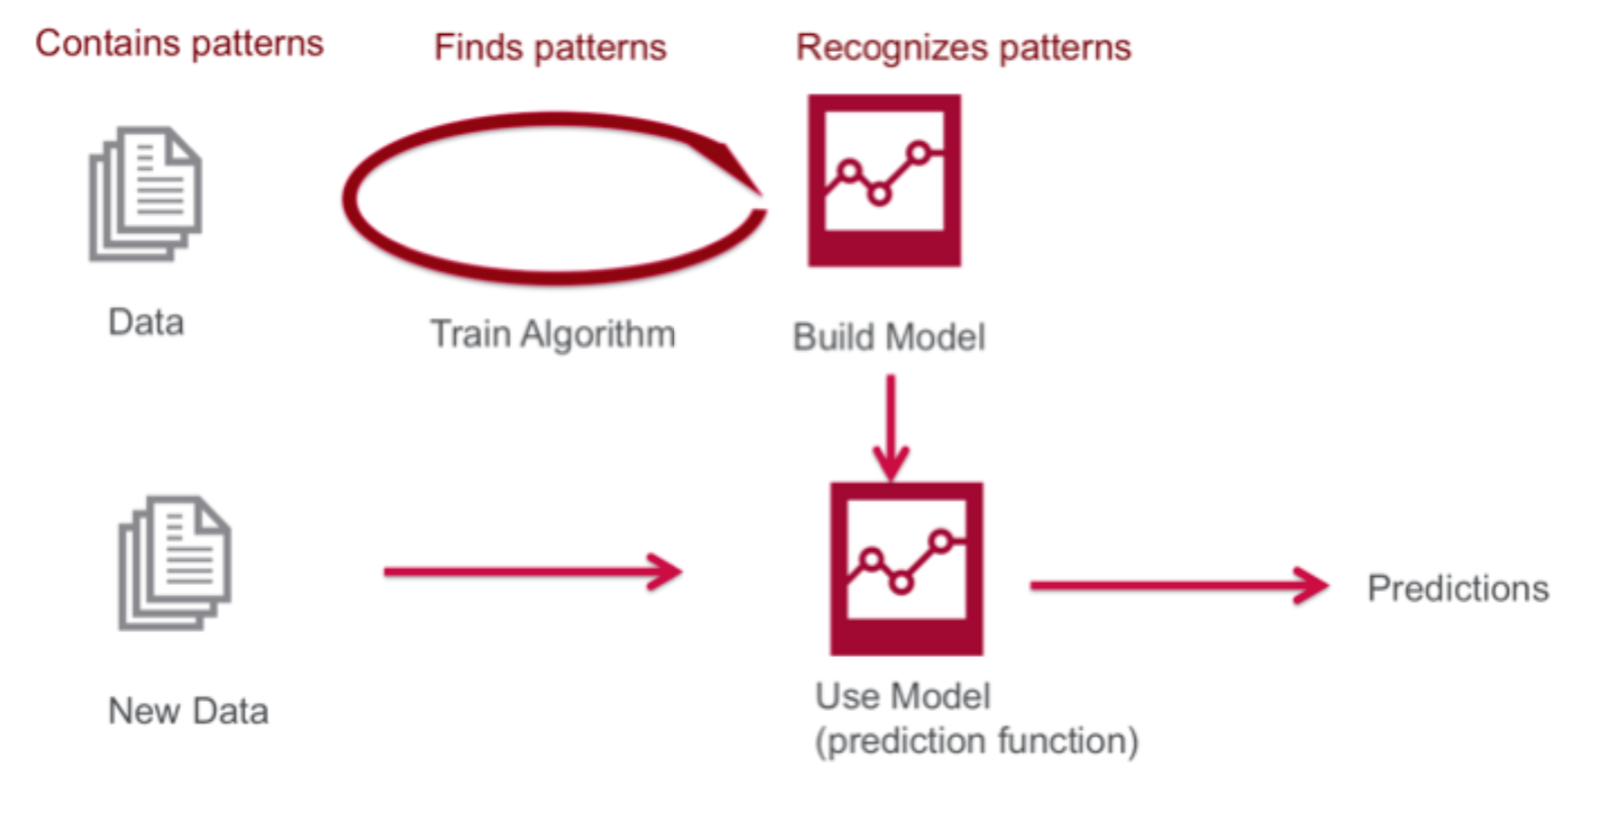
- On average, the training set is much larger than the test set.
- If information from the test set leaks into training, the reliability of the model’s accuracy decreases.
- Poor quality training data leads to unstable, overfitted models.

- The phases can be divided into: Data collection & preprocessing, Training with preprocessed data, and Model application & maintenance.
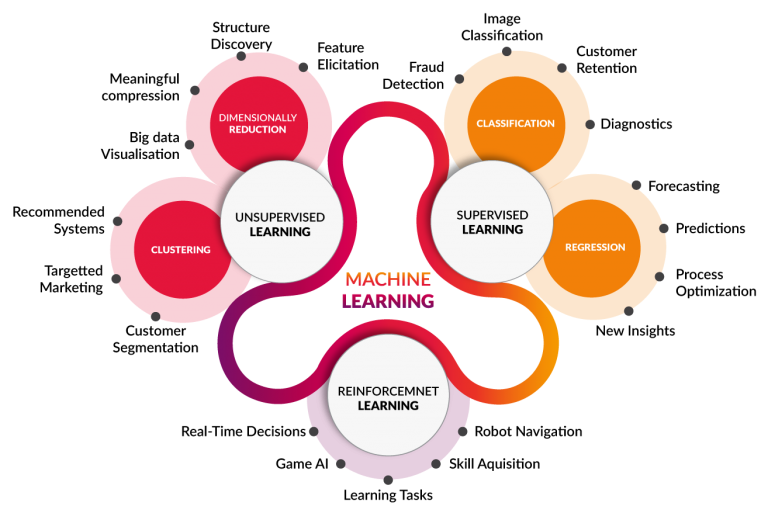
- This diagram illustrates the classification of machine learning techniques:
- Supervised Learning: Learning with both inputs and labels provided.
- Unsupervised Learning: Learning with inputs but no labels.
- Reinforcement Learning: Learning based on rewards in a partially labeled environment.
Supervised Learning
- Builds predictive models based on labeled data (input-output pairs).
- Classification: The outcome is discrete.
- Regression: The outcome is a real or continuous number.
k-Nearest Neighbors (k-NN)
- k-NN is also called Lazy Learning because the training set is used directly during the prediction phase.
- This means the computational load increases as the training set grows.
- The following 4 factors are considered:
- How to define closeness?
- How to decide k?
- How to make predictions?
- Are all instances considered equally important?
- In the implementation below, we answer these as follows:
- Define closeness using Euclidean distance.
- Choose an experimental k (usually odd to avoid ties).
- Use Majority Voting.
- Assume equal weight for all instances.
1
2
3
4
5
6
7
8
9
10
11
12
13
14
15
16
17
18
19
20
21
22
23
24
25
26
27
28
29
30
31
32
33
34
35
36
37
38
39
40
41
42
43
44
45
46
47
48
49
50
51
52
53
54
55
56
57
58
59
60
61
62
63
64
65
66
67
68
69
70
71
72
73
74
75
76
77
78
79
80
81
82
83
84
85
86
87
88
89
90
91
92
93
94
95
96
97
98
99
100
101
102
103
104
105
106
107
108
109
110
111
112
113
import numpy as np
import operator

def classify(x_test, dataset, labels, k):
  dataset_size = dataset.shape[0]

  diff_mat = np.tile(x_test, (dataset_size, 1)) - dataset

  sq_diff_mat = diff_mat ** 2
  sq_distances = sq_diff_mat.sum(axis=1)
  distances = sq_distances ** 0.5
  sorted_dist_indicies = distances.argsort()

  class_count = {}
  for i in range(k):
    vote = labels[sorted_dist_indicies[i]]
    class_count[vote] = class_count.get(vote, 0) + 1
  sorted_class_count = sorted(class_count.items(), key=operator.itemgetter(1), reverse=True)

  return sorted_class_count[0][0]

def file2matrix(filename):
  file = open(filename)
  n = len(file.readlines())
  return_matrix = np.zeros((n, 3))
  class_labels = []
  file = open(filename)
  index = 0
  for line in file.readlines():
    line = line.strip()
    tokens = line.split('\t')
    return_matrix[index, :] = tokens[0:3]
    class_labels.append(tokens[-1])
    index += 1

  return return_matrix, class_labels

'''
Input data format: (annual flight miles, annual video game usage %, annual ice cream consumed in liters)

40920	8.326976	0.953952	largeDoses
14488	7.153469	1.673904	smallDoses
26052	1.441871	0.805124	didntLike
75136	13.147394	0.428964	didntLike
38344	1.669788	0.134296	didntLike
72993	10.141740	1.032955	didntLike
...
...

'''

def apply_normalizer(dataset, offset, divisor):
  dataset_normalized = np.zeros(dataset.shape)
  N = dataset.shape[0]
  dataset_normalized = dataset - np.tile(offset, (N,1))
  dataset_normalized = dataset_normalized / np.tile(divisor, (N,1))

  return dataset_normalized

def normalize_minmax(dataset):
  minval = dataset.min(0)
  maxval = dataset.max(0)

  dataset_normalized = apply_normalizer(dataset, minval, maxval-minval)

  return dataset_normalized, minval, maxval-minval

def normalize_meanstd(dataset):
  meanval = dataset.mean(0)
  stdval = dataset.std(0)

  dataset_normalized = apply_normalizer(dataset, meanval, stdval)

  return dataset_normalized, meanval, stdval

x, y = file2matrix('datingTestSet.txt')
X_normalized, off, div = normalize_minmax(x)
print(X_normalized)
print("offset:", off, "; divisor:", div)

X_normalized, off, div = normalize_meanstd(x)
print(X_normalized)
print("offset:", off, "; divisor:", div)

X, y = file2matrix('datingTestSet.txt')

holdout_ratio = .2

N = X.shape[0]
N_ts = int(N*holdout_ratio)
N_tr = N - N_ts

X_tr = X[0:N_tr,:]
y_tr = y[0:N_tr]

X_ts = X[N_tr:,:]
y_ts = y[N_tr:]

X_normalized_tr, off, div = normalize_minmax(X_tr)
X_normalized_ts = apply_normalizer(X_ts, off, div)

n_errors = 0
y_pred_ts = []
for i in range(N_ts):
  y_pred_ts.append(classify(X_normalized_ts[i], X_normalized_tr, y_tr, 5))
  if(y_pred_ts[i] != y_ts[i]):
    n_errors += 1

print("the accuracy is: %f" % (1 - n_errors/float(N_ts)))
print("the error rate is: %f" % (n_errors/float(N_ts)))

print("\n---- (Y_true, Y_pred) pairs ----")
print(*list(zip(y_ts, y_pred_ts)), sep="\n")
Image source: http://www.cognub.com/index.php/cognitive-platform/
k-NN 알고리즘 및 머신러닝 기초
- AI는 컴퓨터가 사람과 같은 행동을 할 수 있는 기술을 의미합니다.
- ML은 AI를 달성하기 위해 사용되는 방법 중 하나입니다.
- 통계학적 기법을 사용하며 명시적 프로그래밍 없이 데이터로부터 학습하여 문제를 해결하는 기술입니다.
- Deep Learning이란 ML의 기법 중 하나이며, Deep Neural Network 기반의 학습법을 의미합니다.
- 컴퓨터 비전, 음성 처리, 자연어 처리에서 뛰어난 성능을 보이며 가장 활발히 성장하고 있는 분야입니다.
ML 워크플로우 및 분류
- ML의 기초적인 워크플로우는 다음과 같습니다.
- 일반적으로 Training set이 Test set보다 훨씬 큽니다.
- 학습 시 Test set의 정보가 유출되면 모델의 정확도에 대한 신뢰도가 떨어짐니다.
- 데이터의 질이 나쁘면 불안정하고 과적합(Overfit)된 모델이 생성됩니다.
- 단계는 데이터 수집 및 전처리, 모델 학습, 모델 적용 및 유지보수로 나뉩니다.
- 머신러닝 기법의 분류는 다음과 같습니다.
- Supervised Learning: 문제와 답이 모두 주어진 상태에서 학습합니다.
- Unsupervised Learning: 정답 없이 데이터의 패턴을 학습합니다.
- Reinforcement Learning: 보상을 통해 부분적으로 정답이 주어진 상황에서 학습합니다.
Supervised Learning
- 라벨링된 데이터(입력-출력 쌍)를 기반으로 예측 모델을 구축합니다.
- Classification: 결과가 이산적입니다.
- Regression: 결과가 실수 또는 연속적인 숫자입니다.
k-Nearest Neighbors (k-NN)
- 예측 단계에서 Training set을 그대로 사용하므로 Lazy Learning이라고도 불립니다.
- Training set이 많을수록 연산 부하가 큽니다.
- 다음 4가지 요소를 고려합니다:
- Closeness 정의 방법 (거리 측정)
- k 결정 방법
- 예측 방법
- 데이터의 중요도(Weight) 처리
- 아래 코드에서는 다음과 같이 구현합니다:
- Euclidean 거리로 근접성을 정의합니다.
- k는 실험적 값을 사용하되, 타이를 방지하기 위해 홀수를 사용합니다.
- Majority Vote 방식을 사용합니다.
- 모든 데이터에 동일한 가중치를 부여합니다.
1
2
3
4
5
6
7
8
9
10
11
12
13
14
15
16
17
18
19
20
21
22
23
24
25
26
27
28
29
30
31
32
33
34
35
36
37
38
39
40
41
42
43
44
45
46
47
48
49
50
51
52
53
54
55
56
57
58
59
60
61
62
63
64
65
66
67
68
69
70
71
72
73
74
75
76
77
78
79
80
81
82
83
84
85
86
87
88
89
90
91
92
93
94
95
96
97
98
99
100
101
102
103
104
105
106
107
108
109
110
111
112
113
import numpy as np
import operator

def classify(x_test, dataset, labels, k):
  dataset_size = dataset.shape[0]

  diff_mat = np.tile(x_test, (dataset_size, 1)) - dataset

  sq_diff_mat = diff_mat ** 2
  sq_distances = sq_diff_mat.sum(axis=1)
  distances = sq_distances ** 0.5
  sorted_dist_indicies = distances.argsort()

  class_count = {}
  for i in range(k):
    vote = labels[sorted_dist_indicies[i]]
    class_count[vote] = class_count.get(vote, 0) + 1
  sorted_class_count = sorted(class_count.items(), key=operator.itemgetter(1), reverse=True)

  return sorted_class_count[0][0]

def file2matrix(filename):
  file = open(filename)
  n = len(file.readlines())
  return_matrix = np.zeros((n, 3))
  class_labels = []
  file = open(filename)
  index = 0
  for line in file.readlines():
    line = line.strip()
    tokens = line.split('\t')
    return_matrix[index, :] = tokens[0:3]
    class_labels.append(tokens[-1])
    index += 1

  return return_matrix, class_labels

'''
데이터는 아래와 같이 들어오게 된다. (연간 마일리지 수, 연간 게임 사용 %, 연간 아이스크림 소비량)

40920	8.326976	0.953952	largeDoses
14488	7.153469	1.673904	smallDoses
26052	1.441871	0.805124	didntLike
75136	13.147394	0.428964	didntLike
38344	1.669788	0.134296	didntLike
72993	10.141740	1.032955	didntLike
...
...

'''

def apply_normalizer(dataset, offset, divisor):
  dataset_normalized = np.zeros(dataset.shape)
  N = dataset.shape[0]
  dataset_normalized = dataset - np.tile(offset, (N,1))
  dataset_normalized = dataset_normalized / np.tile(divisor, (N,1))

  return dataset_normalized

def normalize_minmax(dataset):
  minval = dataset.min(0)
  maxval = dataset.max(0)

  dataset_normalized = apply_normalizer(dataset, minval, maxval-minval)

  return dataset_normalized, minval, maxval-minval

def normalize_meanstd(dataset):
  meanval = dataset.mean(0)
  stdval = dataset.std(0)

  dataset_normalized = apply_normalizer(dataset, meanval, stdval)

  return dataset_normalized, meanval, stdval

x, y = file2matrix('datingTestSet.txt')
X_normalized, off, div = normalize_minmax(x)
print(X_normalized)
print("offset:", off, "; divisor:", div)

X_normalized, off, div = normalize_meanstd(x)
print(X_normalized)
print("offset:", off, "; divisor:", div)

X, y = file2matrix('datingTestSet.txt')

holdout_ratio = .2

N = X.shape[0]
N_ts = int(N*holdout_ratio)
N_tr = N - N_ts

X_tr = X[0:N_tr,:]
y_tr = y[0:N_tr]

X_ts = X[N_tr:,:]
y_ts = y[N_tr:]

X_normalized_tr, off, div = normalize_minmax(X_tr)
X_normalized_ts = apply_normalizer(X_ts, off, div)

n_errors = 0
y_pred_ts = []
for i in range(N_ts):
  y_pred_ts.append(classify(X_normalized_ts[i], X_normalized_tr, y_tr, 5))
  if(y_pred_ts[i] != y_ts[i]):
    n_errors += 1

print("the accuracy is: %f" % (1 - n_errors/float(N_ts)))
print("the error rate is: %f" % (n_errors/float(N_ts)))

print("\n---- (Y_true, Y_pred) pairs ----")
print(*list(zip(y_ts, y_pred_ts)), sep="\n")
이미지 출처: http://www.cognub.com/index.php/cognitive-platform/